Logistic Regression은 Binary Classification으로
결과값이 0,1로만 나오게 한다.
logistic function은

해당 함수는 z의 값이 음의 무한대부터 양의 무한대까지의 모든 z의 값이 0~1 사이의 값으로 출력이 된다.

linear regression와 다른 cost function을 사용해야함
why?
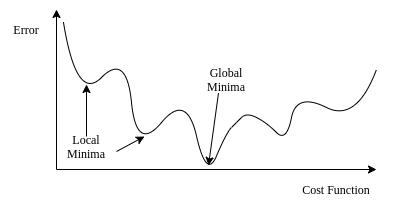
linear regression의 f(x)는 convex한 함수이지만
logistic regression은 convex하지 않기에 gradient descent를 하던 도중 최소값이나 최대값에 갇힐 수가 있기 때문

그렇기에 새로운 cost function이 필요함.
logistic regression out put은 오로지 0,1인 binary classification이기에
y=1일 때, 예측값 σ(wx+b) 가 1에 가까워질 수록 cost function의 값이 작아져야하고 예측값이 틀렸다면
cost function의 값이 커야한다. 아래 log함수가 만족

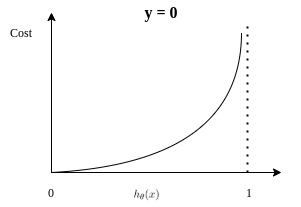
y=1일 때, 예측값 σ(wx+b) 가 1에 가까워질 수록 cost function의 값이 커져야하고 예측값이 틀렸다면
cost function의 값이 작아져야 한다.

cost function은 아래와 같다,

w의 편미분 값

b는 weight의 vector에 추가하여 gradient descent를 진행
python code 부분
import sympy
import numpy

# synthetic data
x_data = numpy.linspace(-5, 5, 100)

#초기값 w = 2 , b = 1
w = 2
b = 1
numpy.random.seed(0)
z_data = w * x_data + b + numpy.random.normal(size=len(x_data))
#z_data에 numpy.random.normal Noise 값을 추가 가우시안 분포에서의 랜덤 값

# y = 2x + 1 + Noise값

y_data = 1 / (1+ numpy.exp(-z_data))
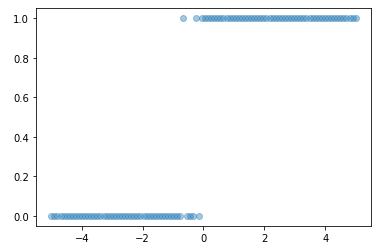
y_data = numpy.where(y_data >= 0.5, 1, 0) # 0.5 보다 크면 1 작으면 0 으로 class 지정
pyplot.scatter(x_data, y_data, alpha=0.4);
from autograd import numpy
# import the gradient calculator
from autograd import grad

def logistic_model(params, x):
    '''A prediction model based on the logistic function composed with wx+b
    Arguments:
       params: array(w,b) of model parameters
       x :  array of x data'''
    w = params[0]
    b = params[1]
    z = w * x + b
    y = 1 / (1 + numpy.exp(-z))
    return y

def log_loss(params, model, x, y):
    '''The logistic loss function
    Arguments:
       params: array(w,b) of model parameters
       model:  the Python function for the logistic model
       x, y:   arrays of input data to the model'''
    y_pred = model(params, x)
    return -numpy.mean(y * numpy.log(y_pred) + (1-y) * numpy.log(1 - y_pred))

gradient = grad(log_loss)
params = numpy.random.rand(2)
max_iter = 5000
i = 0
descent = numpy.ones(len(params))

while numpy.linalg.norm(descent) > 0.001 and i < max_iter:

    descent = gradient(params, logistic_model, x_data, y_data) #loss function의 output
    params = params - descent * 0.01 #가중치 업데이트
    i += 1

pyplot.scatter(x_data, y_data, alpha=0.4)
pyplot.plot(x_data, logistic_model(params, x_data), '-r')
'Kaist 머신러닝 엔지니어 부트캠프 > Study' 카테고리의 다른 글
| Machine learning training 과정 (0) | 2022.05.19 |
|---|---|
| Linear Regression (0) | 2022.05.18 |
| Numpy 관련 (0) | 2022.05.12 |
| Python 관련 (0) | 2022.05.12 |
| 딥러닝 최신 동향 (0) | 2022.05.09 |