시스템 모니터링 시스템을 알아보게 되면서 nagio, cacti등을 알아보았는대
1) ELK + MetricBeat
2) Grafana + Prometheus
이 두가지의 그래픽이 마음에 들게 되어 테스트를 해보게 되었다.
1) ELK + MetricBeat
제일 먼저 docker에 올려서 테스트를 해보았다. 설치할때 X-pack으로 로그인에서 고통을 받았고
alert기능이 유료라는 것을 알게되어 테스트한번 하고 바로 삭제행
(뭔가 ui도 마음에 들지 않았다.)
2) Grafana + Prometheus
- 단점이라고는 ELK의 metricbeat보단 수집하는 것이 적어 보이긴 했지만 추 후 추가 될 것이라고 보이며 현재는 시스템 정보들만 수집하면 되기에 현재 상황과 알맞았다.
인터넷에 바로 grafana + prometheus 검색을하면 설치하는 방법도 잘 된 것들이 많으며 찾기 쉽다.
하다가 제일 문제였던 것은

- HTTP Error Bad Gateway오류가 계속나면서 각각 따로 접속을 할 시 굉장히 접속이 잘되는 것을 확인 하였었다.
설치하는데에는 docker run으로 5분도 안걸리지만 이 에러를 고민하는대 굉장히 많은 시간을 보내게 되었다.
해결방법
- 매우매우 간단했었고 네트워크에 대한 지식이 부족해서 이러한 일이 있었나 싶다.
- 작업 환경 ubuntu18.04 - docker로 promethues,grafana 올림
- windows 10 chrome으로 접속
검색하면 나오는 prometheus docker 실행 명령어
docker run \
    -p 9090:9090 \
    -v /workspace/prometheus.yml:/etc/prometheus/prometheus.yml \
    prom/prometheus
prometheus 설정 파일인 prometheus.yml을 수정한 후 실행한다.
# my global config
global:
  scrape_interval:     15s # Set the scrape interval to every 15 seconds. Default is every 1 minute.
  evaluation_interval: 15s # Evaluate rules every 15 seconds. The default is every 1 minute.
  # scrape_timeout is set to the global default (10s).

# Alertmanager configuration
alerting:
  alertmanagers:
  - static_configs:
    - targets:
      # - alertmanager:9093

# Load rules once and periodically evaluate them according to the global 'evaluation_interval'.
rule_files:
  # - "first_rules.yml"
  # - "second_rules.yml"

# A scrape configuration containing exactly one endpoint to scrape:
# Here it's Prometheus itself.
scrape_configs:
  # The job name is added as a label `job=<job_name>` to any timeseries scraped from this config.
  - job_name: 'prometheus'

    # metrics_path defaults to '/metrics'
    # scheme defaults to 'http'.

    static_configs:
    #- targets: ['localhost:9090']
    - targets: ['my_server_ip:9090'] #localhost를 server ip로 변경
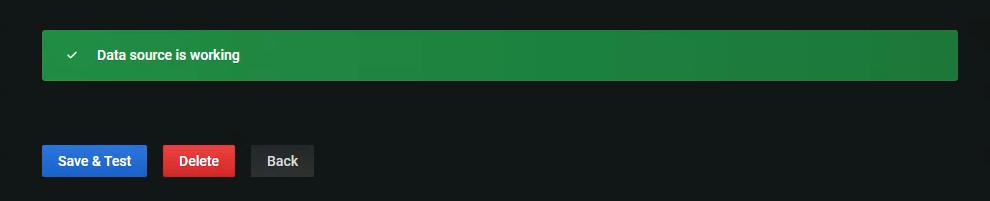
grafana에서 prometheus를 추가하는 url부분을 localhost가 아닌 ip로 주면 해결완료
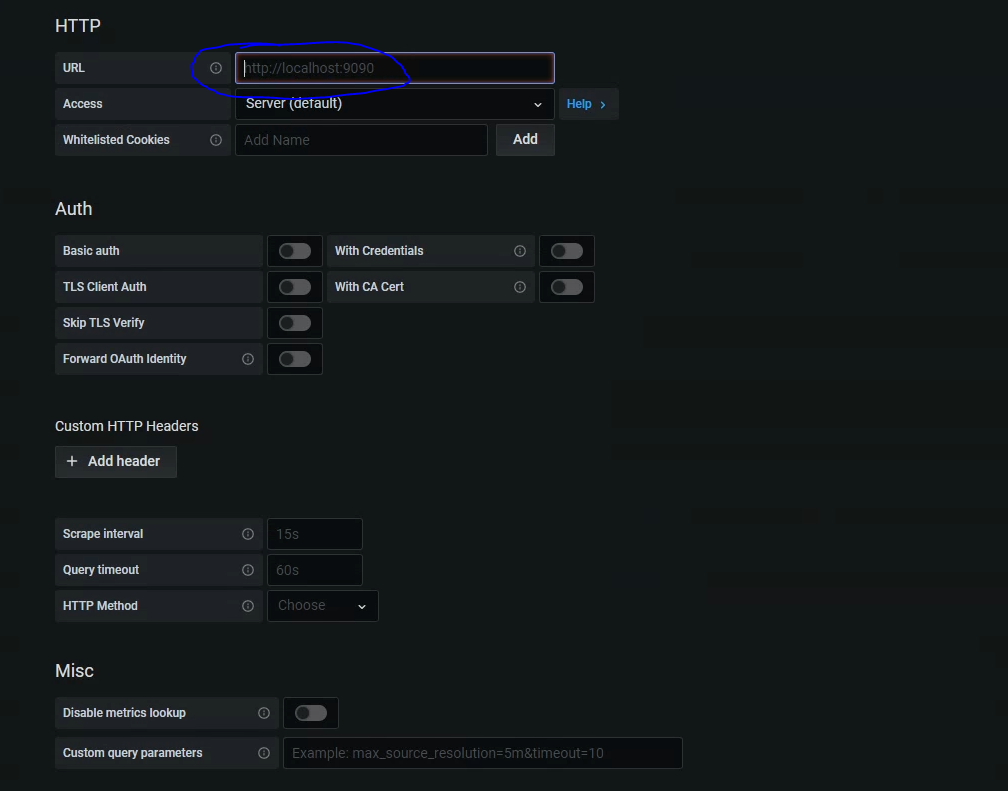
save&test를 눌러보면 잘되는 것을 확인!
- 계획했던 개발들이 진행이 지연되고 있어서 굉장히 안타깝다.. 간단한줄 알고 시작했던 일들이 너무나도 오래걸리며 알아야할 지식들이 필요하다.
- 이것도 또 하나를 배우는 과정이라 생각하며 끝! 다음에는 windows와 linux centos에 exporter들을 설치를 진행해보려한다.